• About us
  • Pricing
  • Blog
  • Contact
Request a free demo
Get started
Productivity Tools

Free alternative to Microsoft Visio Data Visualizer (data driven flowchart)

June 18, 2024 Querychart Admin No comments yet

Data Visualizer, a feature in Microsoft Visio, allows users to create flowcharts, also known as process flow diagrams, using data from Microsoft Excel. Unlike traditional methods involving manual box and line placement, Visio Data Visualizer offers an efficient alternative.

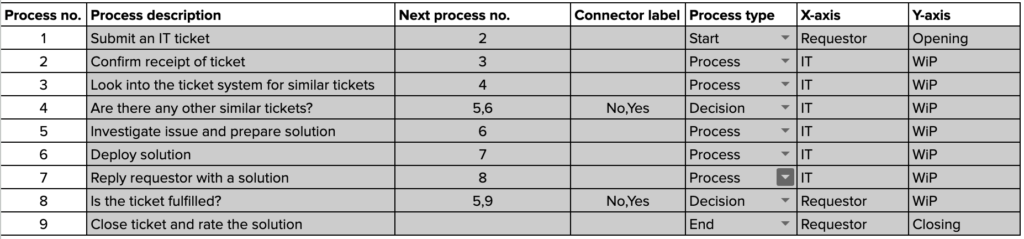
This tool utilizes a fixed data table template in Excel to control the flowchart. By processing the data in this table, Data Visualizer generates the process flow diagram. Access to Microsoft Visio Data Visualizer requires a subscription of Visio Plan 2, which costs $15 a month.

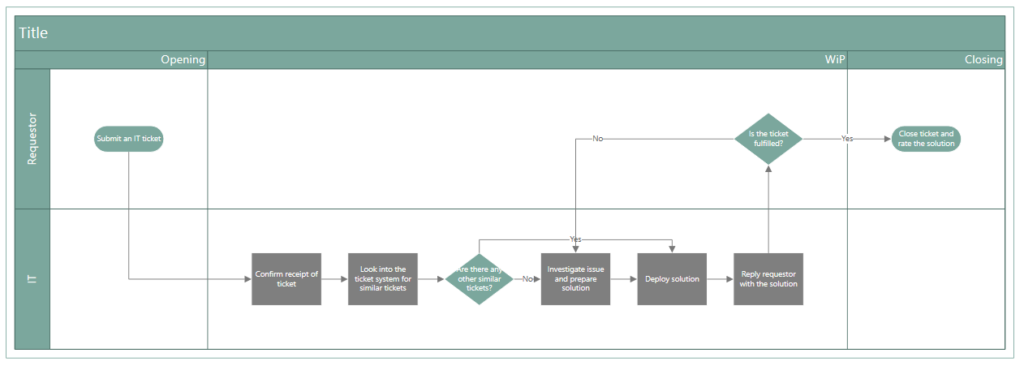
Below, you’ll find an example of a data-driven flowchart created with Microsoft Visio Data Visualizer along with its corresponding data. Further down, you’ll see a flowchart generated with Querychart (more details provided below).

Data used to generate a flowchart with Microsoft Visio Data Visualizer.
The flowchart generated with Microsoft Visio Data Visualizer using the data from the image above.
The flowchart generated with Querychart using the data from the first image. Click here to see the live flowchart and its data.

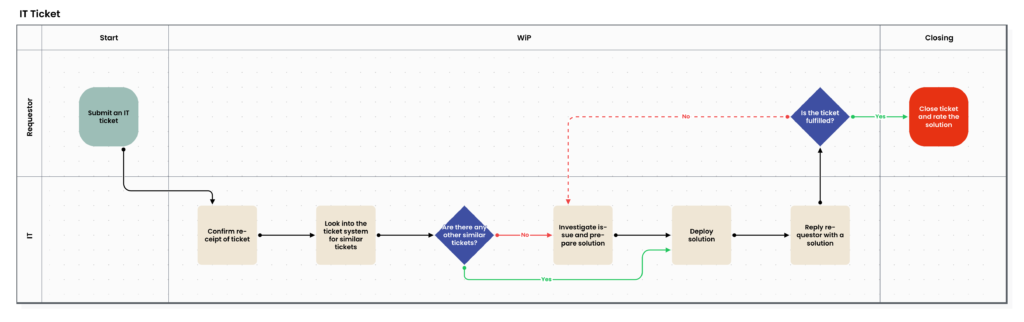
Querychart is a flowchart generator that also allows users to generate process flow diagrams with data in a web application. However, Querychart offers more features than Microsoft Visio Data Visualizer for customization and navigation of the process flow diagram. The visual presentation of the process flow is also more refined and contemporary.

You can sign up for free and generate flowcharts with data at app.querychart.io.

Post navigation

Previous
Next

Leave a Reply Cancel reply

Your email address will not be published. Required fields are marked *

Search

Categories

  • Organization 2
  • Productivity Tools 3

Recent posts

  • The Ultimate Process Library: Centralizing Your Organization’s Workflows
  • Optimize Your Team’s Business Operations: Standardizing and Scaling with Flowcharts
  • How To Make Flowcharts Using ChatGPT (Text-To-Flowchart) With No Setup And Configuration

Tags

AI Flowchart business operations Chatgpt flowchart data-driven flowchart datavisualization data visualization tool E2E process framework flowchart flowchart generator flowchart software Microsoft Visio Data Visualizer process diagramming process flow diagram process library process management Text-To-Flowchart

Continue reading

Organization

Optimize Your Team’s Business Operations: Standardizing and Scaling with Flowcharts

June 22, 2024 Querychart Admin No comments yet

To drive business growth, streamline procedures for versatility and efficiency, especially in managing turnover. Standardized processes are vital, and using flowcharts with data ensures uniform design, enhances readability, and boosts productivity. Join app.querychart.io for free.

Productivity Tools

How To Plot A Flowchart Using Data In A Spreadsheet

June 15, 2024 Querychart Admin No comments yet

Spreadsheet data can create various charts, now including flowcharts with Querychart for faster, more consistent process visualizations.

A Danish startup

Product
  • Pricing
  • Data-Driven Flowcharts
  • Dynamic Flowcharts
  • Text-To-Flowchart
Resources
  • Blog
  • Querychart Help
Company
  • About us
  • Contact
  • Terms & Conditions
  • Privacy Policy